 |
Alpine3D 20260722.7a3e327
Spatially distributed alpine surface processes model
|
|
Alpine3D 20260722.7a3e327
Spatially distributed alpine surface processes model
|
Several categories of data are necessary for the input:
The landscape data can be prepared with any GIS software (for example, the Open Source QGIS), the meteorological data with statistical computing tools (for example R) or scripts (for example Python or AWK) and the snowcover data has to be prepared with scripts.
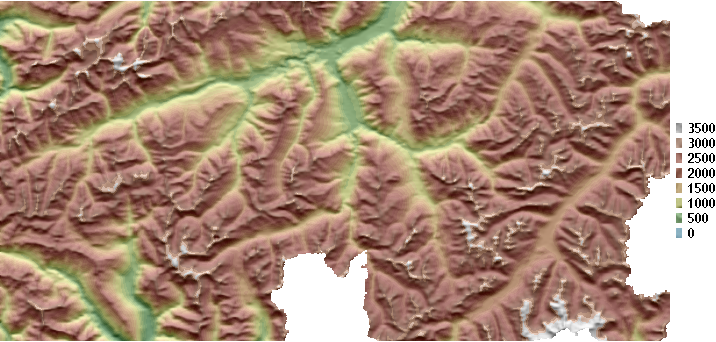
Once you have defined the domain that you want to simulate, you have to get a Digital Elevation Model that contains this area. The DEM must be rectangular, but you will be able to restrict the actual domain within this rectangular area by settings the cells you want to ignore to nodata. However, you need to keep in mind the following:
These last two points are important for both the definition of the rectangular DEM as well as filling the necessary cells with nodata. All other grids (either land cover or potential meteorological grids) will have to use the exact same geolocalization as the DEM (same position, same size, same resolution) unless otherwise specified.
DEM data can either come from your own measurements (for example from laser scans, see P. Axelsson, "DEM generation from laser scanner data using adaptive TIN models", International Archives of Photogrammetry and Remote Sensing, 33.B4/1, PART 4, 2000, pp 111-118), from your national topographic service (Swiss Topo for Switzerland, IGN for France, National Elevation Dataset for the USA, HeliDEM for the southern Alps) or from global initiatives ( GTOPO30, a 30-arc-second global dem, GLOBE, a 30-arc-second global dem, SRTM, a 1-arc-second global dem between 60N and 56S averaged at 90m resolution, ASTER DEM, a 30m resolution global dem between 83N and 83S).
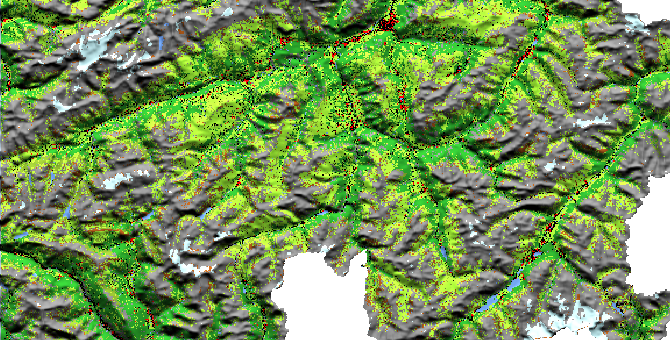
For each cell of the domain, a land cover code must be provided. This must be using the exact same geolocalization as the DEM. You can create you own LUS file based on aerial photography (see in section simulation tools) or find such data for your area of interest. Such data are usually available in various classifications depending on the country, for example:
Currently, Alpine3D improperly calls the Land Cover Model "Land Use", abbreviated as LUS and uses an ARC ascii file (see MeteoIO's documentation) with PREVAH landuse codes that have the format 1LLDC where:
|
|
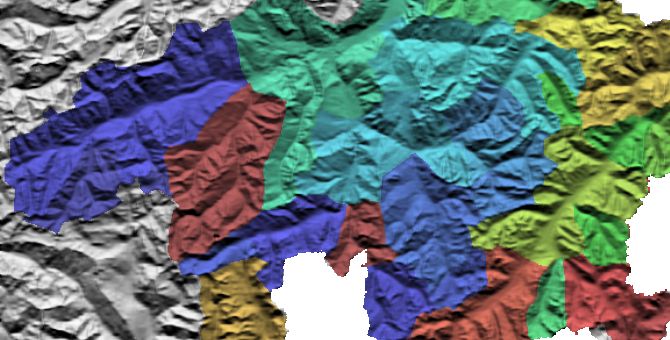
For hydrological modeling, hydrological subcatchments must be defined. Both the precipitation, snow melt and glacier melt contributions are provided as well as the total catchment runoff, for each subcatchment. The subcatchments are defined by creating a grid that contains a code describing which catchments this cell belongs to, based on sums of powers of two. For example, a pixel belonging to catchments 0 and 3 would receive the code: 2^0+2^3=9. A pixel belonging to catchments 2, 5, 6 would receive the code 2^2+2^5+2^6=100. Finally, this grid must have the same geolocalization as the dem.
Either each cell must be assigned an initial soil and snow profile (as well as a few Canopy parameters). Usually, to make things easier, the simulation starts at a time when no snow is present in the domain, making the snow profile empty. The same file also contains potential soil layers data. This file is written in a Snowpack snowfile supported format (see Snowpack documentation, "Data File Formats" > "Single Snow Profiles") and usually kept with all other similar files in a separate directory (in order to keep the simulation tidy). Finally, the profile and layers must be dated from before the simulation starts.
There are two possibilities for assigning these files to each cell of the simulation domain (see reading snow files):
Usually, the meteorological inputs are provided as point-measurement time series and spatially interpolated within alpine3d (using meteoio). But it is also possible to provide some (or all) data as gridded data.
Meteorological inputs often come from automatic weather stations that are part of a measurement network (for example M. Lehning et al. "A network of automatic weather and snow stations and supplementary model calculations providing snowpack information for avalanche warning", Proceedings of the International Snow Science Workshop “a merging of theory and practice”, 27, 1998 or the US SNOTEL network) or are deployed for a specific experiment and area. The networks are often managed by national weather services.
It is also possible to find some other data producers such as airports, Synop stations (a script to download and convert the data is available in MeteoIO's tools directory), railways operators, highways (or this), ski lift operators, network of citizen weather stations.
Another source of data can be reanalysis runs performed with weather forecasting models on measured data (UK metoffice, Norvegian Meteorological Institute, Euro4M for all of Europe as well as worldwide NOAA ESRL and ECMWF (with associated DEM) reanalysis).
This is mostly centered around the concept of station: a specific point in space where multiple parameters are measured for a given period. The file formats vary greatly depending on which meteo plugin is used. It is nevertheless always possible to use stations that don't cover the whole period or contain data gaps. It is also possible to use stations that are outside the domain (but they should not be too far away, otherwise this does not make sense!). The model will run with an hourly resolution, so the data should be either hourly or could be meaningfully resampled to an hourly resolution (i.e., daily measurements would usually not qualify). Please note that in any case, the following must always be provided:
If the air pressure (P, usually in Pa) is provided, it will be used for improving some of the parametrizations, but this is absolutely not mandatory. However, it is recommended to provide stations well distributed over the domain and over the elevation range, so the elevation gradients can be properly computed.
This relies on meteoio's USER spatial interpolation algorithm. The grids must follow a specific naming scheme and be placed in a specific directory so they can be found and the grids must have the same geolocalization as the dem. This is detailed in meteoio's documentation.
Please note that if not all necessary grids are provided, meteoio will revert to point measurements inputs (according to the spatial interpolation algorithms declared in the configuration file). It is therefore possible to only provide a few specific grids according to the needs (for example, the precipitation grids only when precipitation occurs).